
Beginners guide to Static Application Security Testing ( SAST) using SonarQube
Written By Sai Adithya Thatipalli
In today’s modern world, Web applications have become part of every business and play a key role in their operations. Many businesses are hosting their applications with the help of Cloud Infrastructure making the Application development process more crucial.
The more complex and dynamic we create applications, the more secure the application should be. Since the rise of SaaS applications, user data stored by these applications are also important. To maintain that application should be testing from a security point of view along with the functional testing.
What is Security Testing?
Security testing is a process of reviewing the application on each layer level to identify bug issues, code level issues, parameter level issues, connectivity and functionality level issues.
Based on the applications, there are different types of Security Testing methods are used
- Static Application Security Testing (SAST)
SAST is one of the most used methods to check the application security. In this method, we review the source code of the application, application user interface, connectivity and application loopholes based on Web Application Security Best practices and Known Vulnerabilities.
- Dynamic Application Security Testing (DAST)
DAST is another widely used methodology for applications. It is used mostly on applications which are running and consistently updated with new features and functionalities. It is testing from outside by reviewing the features, sending requests, testing OWASP top 10 attack methodology against the application.
- Interactive Application Security Testing (IAST)
IAST is a way of doing above both. In this method, Application will be scanned for source code vulnerabilities and also interacted to know functional issues.
How to perform SAST using SonarQube
SonarQube is an automatic code review tool to detect bugs, vulnerabilities in your Application packages. It can integrate with your existing project life cycle or in your CI/CD if it’s a DevOps cycle .
SonarQube is a web console managed tool which can be run from a standalone machine or from a docker.
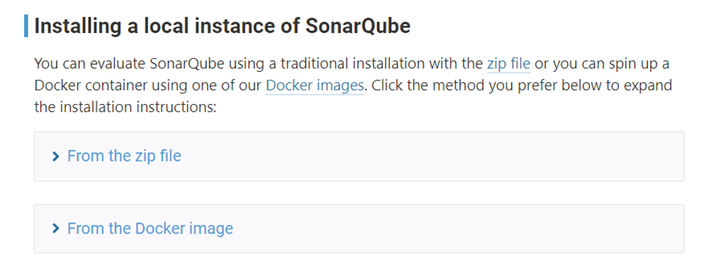
SonarQube can be installed on a standalone machine or run from docker. There are some prerequisites which need to be fulfilled in order to make sonarQube function efficiently. Sonaqube requires Java 11 to be installed on the machine.
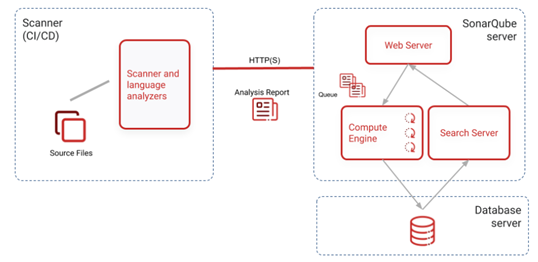
SonarQube consists of 3 components.
- Scanner to scan the code files
- Compute Engine to review the code for bugs issues and
- Database server to store configuration files and reports
Once you download the package on your system along with the latest java. Navigate to binary folder of SonarQube and open your terminal.
Run the SonarQube Batch file

Once it is completed you will see the status of SonarQube up and running. You can access it through your web console.

Login with the default credentials given by SonarQube and create your project. After you create your project name, you can import the project from various sources.
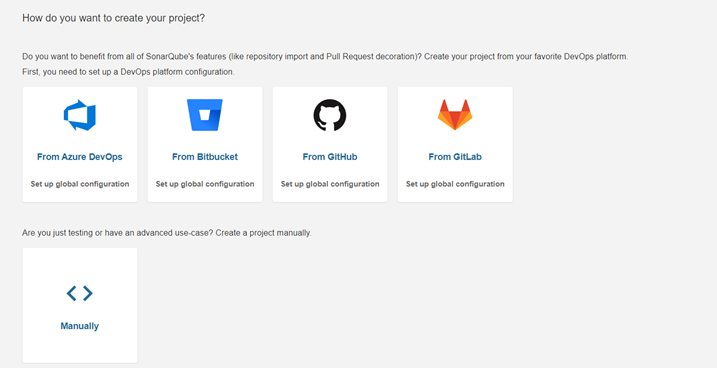
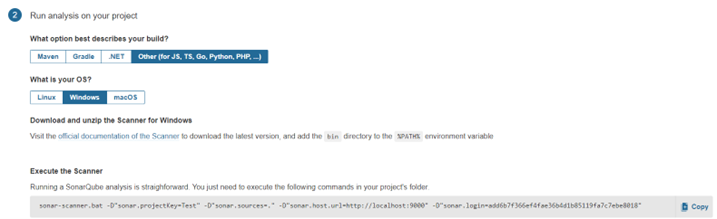
Let’s choose the Manual option for this time for scanning our code. For pulling the code to the master repository we need an authorization token and Sonar scanner.
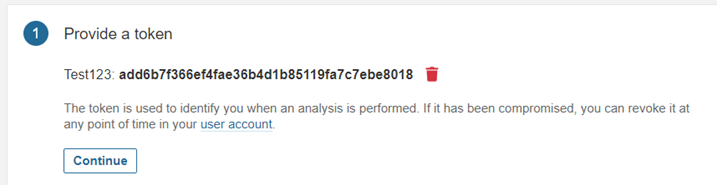
In this tutorial we are taking the vulnerable OWASP Node Goat project for our tutorial. Once we generate our token, we need to select the language in which our project was built.
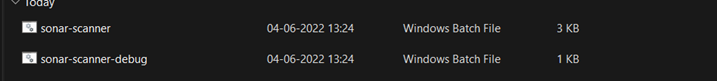
I have installed the scanner in my machine and also the Node Goat project from the OWASP git repository.
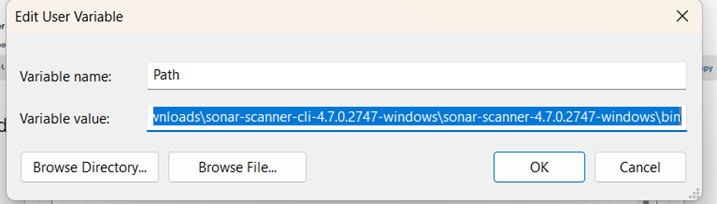
For the scanner to run, you need to add the path of binary to %PATH% env variable in windows. Once it is done, you can navigate to the project page and open your cmdlet.
We can add the path in env variable by searching “Edit your environment variables” in windows search. It will open us a pop-up window where we can add our custom variables
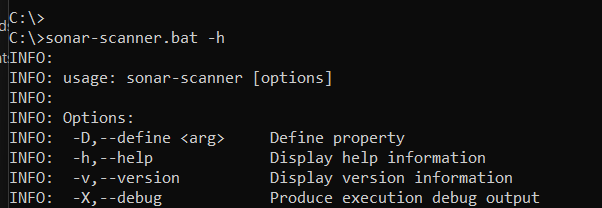
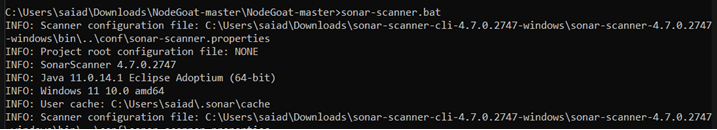
Now you can verify the installation by opening a new cmdlet and execute command “sonar-scanner.bat” which will show below result
I navigated to my project and opened a new console and executed the command along with the auth token which was shared from the console. Let it complete the process and…
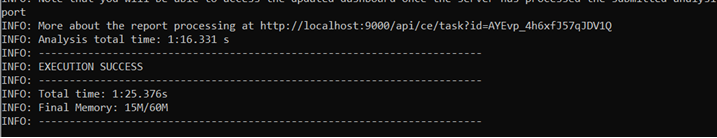
We can see that the scanning of the project is completed and all the files have been pulled. Let’s go back to our web console,
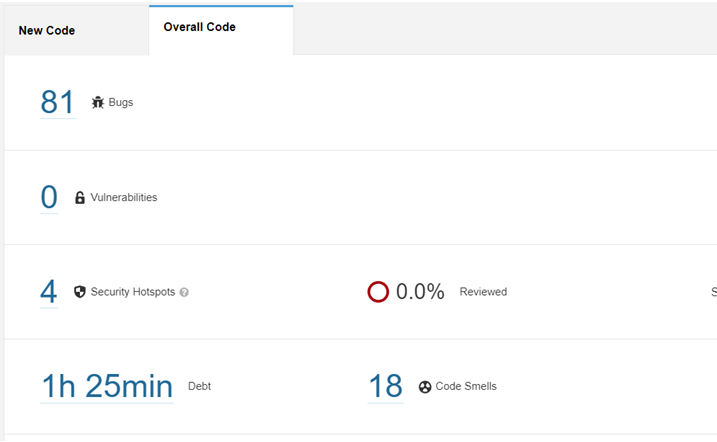
Our code has been successfully reviewed and we can see the result of the code review. It included elements like Number of Bugs, time taken to scan, number of code issues, security loopholes which need to be fixed.
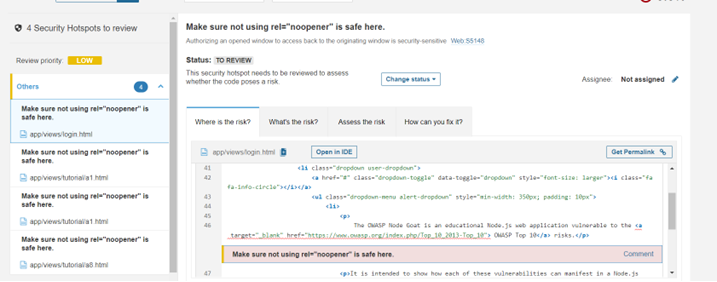
Once we click on bugs, we can get the full details of the bugs.
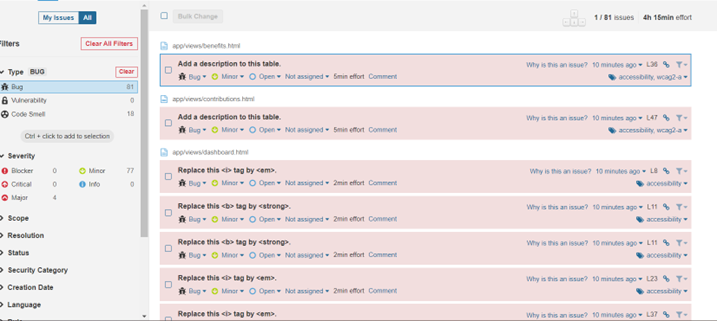
If we look at the display, the list can be filtered based on many parameters like Severity, Scope, Resolution status, Security category etc. Each bug has been reviewed, given recommendation and also we can assign, comment on each bug to track the status. There are other tabs like Security Hotstops, Measures, codesmells which give us more details on the project which includes the code level fixes, overall code performance, reliability etc.
This is how we can scan our project for code level issues. This is a one-time process but when it comes to enterprise level projects, we can integrate this in our CI/CD pipeline with integrating Jenkins, Git, and Azure AD.
Apart from this there are many features which SonarQube provides. It can be integrated with SAML auth, manage multiple projects, Integrate external Analyzers for Android etc. SonarQube can now be installed in a cluster mode also so that they can run in multiple nodes and can be managed by Kubernetes.


 using SonarQube)