
By Nazifa Alam
Wireshark, originally known as Ethereal, is an open-source packet analyser. The purpose of the platform is to enable users the ability to trouble-shoot network connections, analyse network connections, analyse data packets, develop software and develop protocol development.
These analyses can be done in real time or offline. By using Wireshark, users can filter and focus on the root of detected issues to improve network security. Multiple capture formats including CAP and ERF are supported. Wireshark is also fitted with the decryption tools necessary for showing the user typically encrypted protocols such as WEP, WPA and WPA2.
The 3 Main Purposes of Wireshark
As introduced, Wireshark provides the user the ability to examine their data packets. In addition to this, Wireshark serves three main purposes:
- To observe network connection in real time and capture data packets.
- To filter irrelevant data and obtain specific data you are looking for.
- To provide the user with the opportunity to select any part of the network packet (the beginning, middle or end) and visualise the entire network streams and the back-and-forth data transfers.
How to Install Wireshark
Windows Installation
If your device operates with Windows, you can simply download Wireshark directly from the website. During the installation process, you will be asked to download either WinPcap or Npcap as these are fitted with the ability to capture real time data.
You need to then run Wireshark as an administrator. This can simply be done by clicking on the home task bar, searching for Wireshark and then selecting Run as administrator.
With masOS, you will need to right click the Wireshark app and then click Get Info. Then, you will need to go to the Sharing & Permissions settings and enable the Read & Write privileges.
Linux Installation
You will first of all need root permission to use the following commands:
$ sudo apt-get install wireshark
$ sudo dpkg-reconfigure wireshark-common
$ sudo usermod -a -G wireshark $USER
$ newgrp wireshark
Once the commands above have been entered in that order, you will need to then log out then log back in. After this, you can start Wireshark using $ wireshark.
For Linux and Unix based systems, you can also find the needed codes at the bottom of the Wireshark download page, under Third-Party Packages.
How to Use Wireshark
Once downloaded, it is relatively simple to capture packets. You need to remember however, that you must have administrative control to use the platform effectively.
You will need to scroll over to Capture. Then, you will be provided with a list of available interfaces depending on your location as some areas will contain more interfaces.
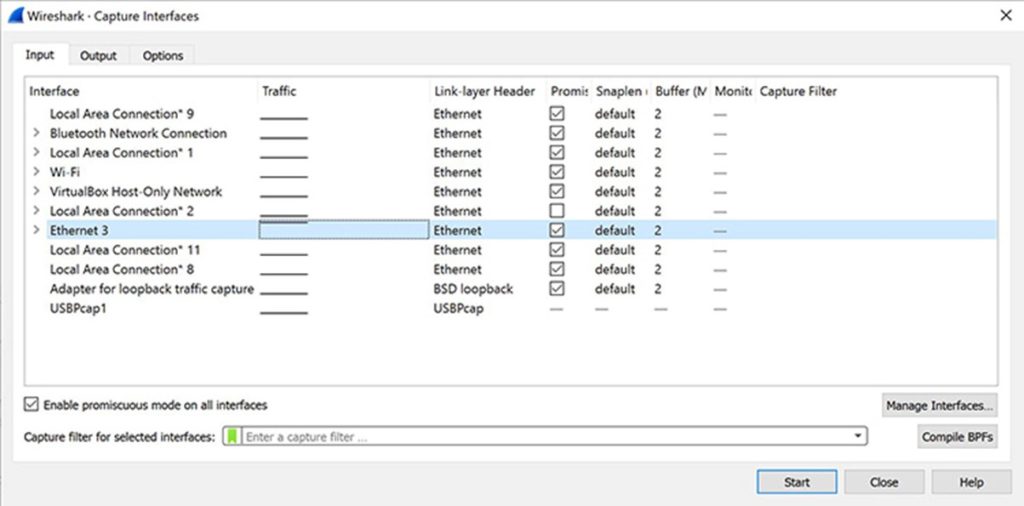
Once you press start following on from your selection, you can choose the Save As or Export options from File to record the capture.
Analysing the Packets
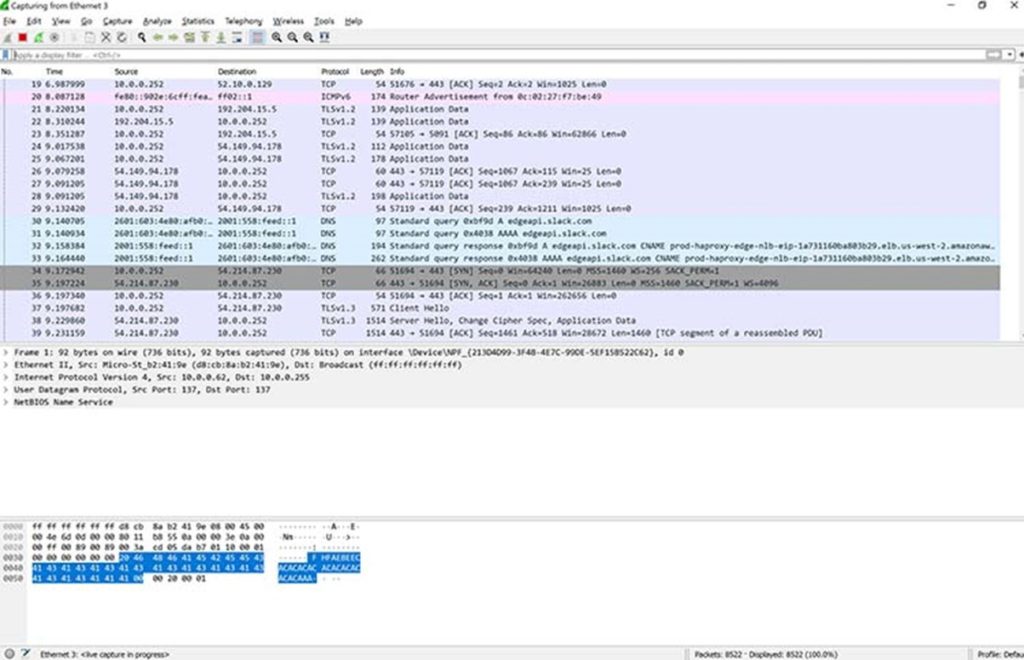
Your data capture will be separated into three sections:
- The Packet List Pane.
- The Packet Details Pane.
- The Packet Bytes Pane.
The Packet List Pane
In these columns, you will find information pertaining to the:
- Number of the packet.
- The time of which the packet was captured.
- The source of the packet.
- The name of the protocol of the packet.
- The packet’s length.
- Other additional information.
The layout example below has been sourced from CompTIA:
The Packet Details Pane
The middle section presents further details concerning the protocols and the protocol fields of the selected packet (highlighted in the first section of the image). These can be filtered further by scrolling over the desired item and right clicking it.
The Packet Bytes Pane
The bottom section shows the raw data of the highlighted packet. The layout of the data is typically done in a hexadecimal manner.
Filtering
Wireshark by default offers its users a large number of fixed filters. Users can record specific packets by selecting Apply a display filter, located below the Wireshark toolbar. Alternatively, users can opt to select Enter a capture filter option which can be found in the middle of the welcome screen.
You can simply type the exact filter you wish to apply. Wireshark also provides autocomplete, making it easier for you to provide the filter you wish to.
Using the Colour Coding Features
Another highly helpful feature Wireshark provides to its users is the colourisation function which, as the functions name suggests, colour codes the packet list. To apply it, you need to select View and then Colorize Packet List. To understand what each colour stands for, select Coloring Rules.
Below are the default colours assigned to the primary packet types appearing in your list:
- Light purple – TCP (Transmission Control Protocol).
- Light blue – UDP (User Datagram Protocol).
- Black – Packets with errors.
- Light green – HTTP (Hypertext Transfer Protocol) traffic.
- Light yellow – Windows traffic, including Server Message Blocks (SMBs) and NetBIOS.
- Dark Yellow – Routing.
- Dark Grey – TCP, SYN, Fin and ACK traffic.
This article serves as a starting point for those wishing to try and monitor their network for the first time. Slightly simplified, this article aims to provide readers with a few directions and break down the idea that the task does not need to be as intimidating as it may appear.


