
How to use Wireshark at Enterprise Scale
Post Credit: Austin Miller
If you were lucky enough to attend the SharkFest this week, you will know about Stephen Donnelly’s presentation on implementing Wireshark at enterprise scale. This tool should be well known by everyone reading this newsletter but making the jump from analyzing packets in a small to medium business setting to full enterprise solutions is difficult.
Thankfully, this talk offered plenty of tips in how to effectively implement the open-source tool into the day-to-day life of a network administrator or cybersecurity analyst in a full enterprise setting. Here are some of the key findings that I took away from the SharkFest celebration of the best tool for traffic analysis available right now.
Wireshark at Enterprise Scale
Why is Wireshark difficult to use in an enterprise setting?
Although using Wireshark is easy for anyone with basic networking training, implementation in large organizations comes with many challenges. Scale and comprehension are the two key difficulties.
Scale
This is essentially the main problem. Due to the size of an enterprise network, they usually have multiple capture points with high-speed links. Each of these points takes in a huge volume of data, meaning that administrators and analysts really need to think about the cost-benefit analysis of extensively scanning everything that is coming into the network.
Comprehension
Using Wireshark’s graphical user interface (GUI) is fine when you are dealing with a few computers, but trying to do that with hundreds of machines? You’re asking for a bad day at the office.
Learning how to use visualization tools that help create a human-friendly interface for Wireshark is key to taking important lessons from network analysis. Indexing the findings helps make the network traffic searchable and human-digestible, in turn making each capture from Wireshark a key data point when extensive logs are needed.
Learning to scale up
Scaling up is multi-faceted and takes some considerable thought. Where do I monitor? How much storage do I need? What do I do with difficult files?
Where do I monitor?
Choosing where to monitor is probably the most difficult part of implementing Wireshark at an enterprise level. We know what we want to look for, but where is a good place to monitor?
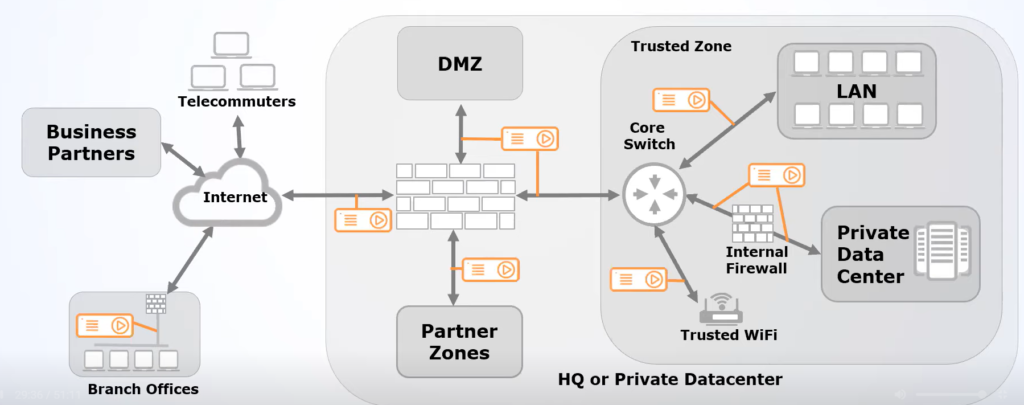
Looking at the diagram given by Stephen Donnelly, the answer is basically: everywhere you can. Installing a packet broker at every link available to you is the best way to feed information back to Wireshark. Of course, that’s not necessarily possible for everyone, so the best advice is “if you can’t install packet brokers everywhere, you should install them at the points with highest traffic load and administrative boundaries”. These areas are invariably where internal services meet the internet.
How much storage do I need?
As with all logging tasks, you need plenty of space to save your findings in. Without adequate storage space, you will quickly run out of room to keep your Wireshark logs. When you crunch the numbers, you will find that the average enterprise (assuming a Gigabit internet connection) will need the following amount of storage space for Wireshark that is logging everything.
1Gbps = 125MB/s
125MB/s x 3600s (i.e., one hour) = 450GB/hr
450GB/hr x 24 (i.e., one day) = 10.8TB/day
10.8TB/day x 7 (i.e., one week) = 75.6TB/week
Now, bear in mind that network links are bi-directional – this means that for a single week of logging everything that Wireshark is capable of logging, you will need at least 151.2TB to capture that data across one Gigabyte link. If you plan on using Wireshark for continuous capture, you need to seriously upgrade your storage.
What do I store?
Because the data storage requirements are quite large, compression and truncation are key. Identifying what you keep helps you store efficiently, especially when incompressible data will quickly become a thorn in your side if not dealt with correctly.
Some network data compresses well – indeed, data such as packet headers, text files, html, and JSON data can all be compressed to half their size or more. If you are focusing on compressible data, you will quickly develop healthy stores of useful logs.
On the other hand, some data isn’t compressible – this includes media files and encrypted data. Some incoming data should be discarded out of hand but truncating the incoming messages for media and encrypted files to just their packet headers is an excellent way to save on the overall storage requirements.
How do I know what to compress?
The best way to do this is to implement tools that will measure the payload entropy – effectively testing how regular or random something is. Simple files tend to have low levels of entropy, such as text files that typically fall within the ranges of 4 and 5 bits. Encrypted data is usually over 7.5 bits, however. With a simple Shannon entropy tool, you can divide up and automatically compress logs as necessary. This is especially useful for finding malware because it is usually highly complex – if you weren’t expecting encrypted data to be delivered without keys, you know that a high entropy file is worth investigating.
For Windows users, the Sysinternals Sigcheck is perfect for measuring entropy through the command prompt.


